

share market free course-2
Discover the world of share markets through our share market free course. Learn the fundamentals of investing, understanding stock market dynamics, analyzing market trends, and making informed decisions. Explore various investment strategies, risk management, and portfolio diversification techniques. Uncover the secrets of successful investors, delve into stock valuation methods, and grasp the significance of macroeconomic factors on market movements. Gain practical insights into reading financial statements, interpreting company performance, and identifying potential growth opportunities. Join our free course and empower yourself with the knowledge and skills to navigate the share market confidently. Start your journey towards financial success today through our share market free course.

Participants will have a clear understanding of how the share market functions and how to harness its potential to achieve their financial goals. With this newfound knowledge, aspiring investors can confidently embark on their journey in the fascinating world of the share market.
share market free course-2 Types of candlestick
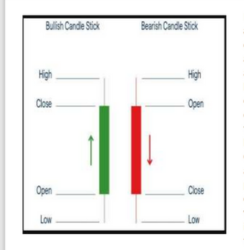
In share market free course-2 we discuss about candlestick chart.In order to create a candlestick chart, you must have a data set that contains open, low and close values for each time period you want to display. The hollow or filled portion of the candlestick is called “the body”. The long thin lines above and below the body represent the high/low range and are called “shadows”(also referred to as “wicks” and “tails”).
The high is marked by the top of the upper shadow and low by the bottom of the lower shadow. If the stock closes higher than its opening price, a hollow candlestick is drawn with the bottom of the body representing the opening price and top of the body representing the closing price.
If the stocks close lower than its opening price, a filled candlestick is drawn with the top of the body representing the opening price and the bottom of the body representing the closing price.
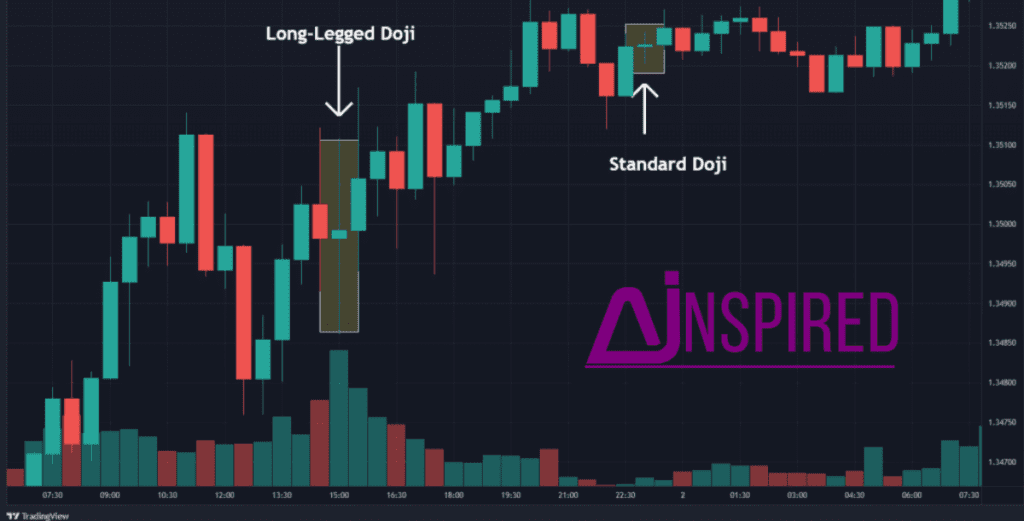
A long- legged Doji
In share market free course-2 we discuss about a long- legged doji candlestick.
A long legged doji is a far more dramatic candle. It says that prices moved far higher on the day, but then profit taking kicked in. Typically, a very large upper shadow is left. A close below the midpoint of the candle show a lot of weakness.
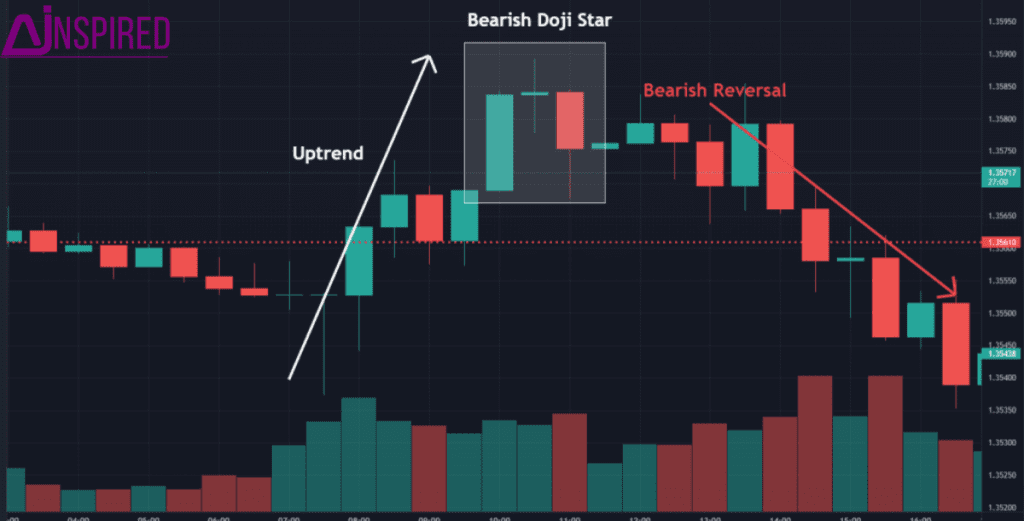
A Doji Star
In share market free course-2 we discuss about a doji star candlestick.
A doji represents an equilibrium between supply and demand, a tug of war that neither the bulls nor bears winning. In the case of an uptrend, the bulls have moved higher. Now the outcome of the latest skirmish is in doubt. After a long downtrend, the opposite is true. The bears have been victorious battles, forcing prices down. Now the bulls have found courage to buy, and the tide may be to turn.
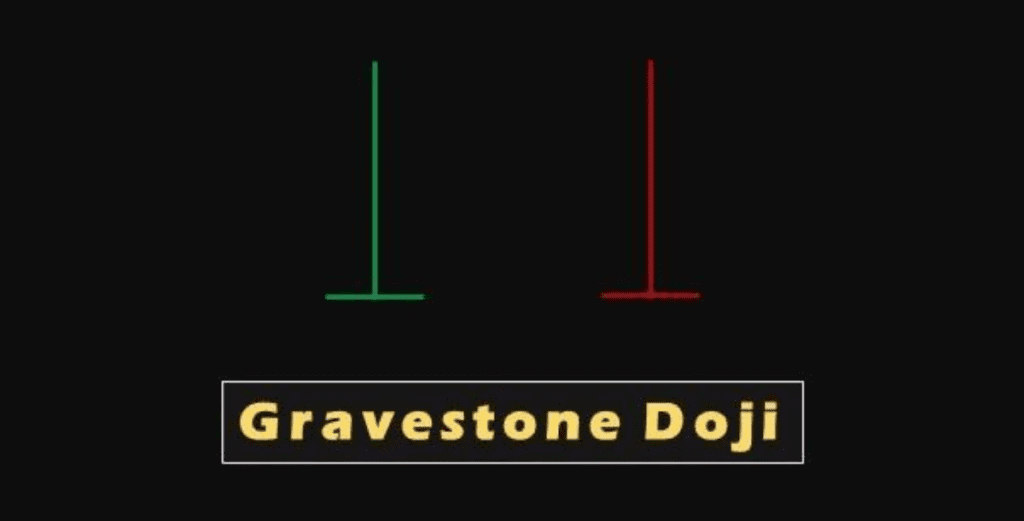
Gravestone Doji
In share market free course-2 we discuss about a Gravestone doji candlestick.
A gravestone doji as the name implies, is probably the most ominous candle of all, on that day, price rallied, but could not stand the altitude they achieved. By the end of the day. they came back and closed at the same level.
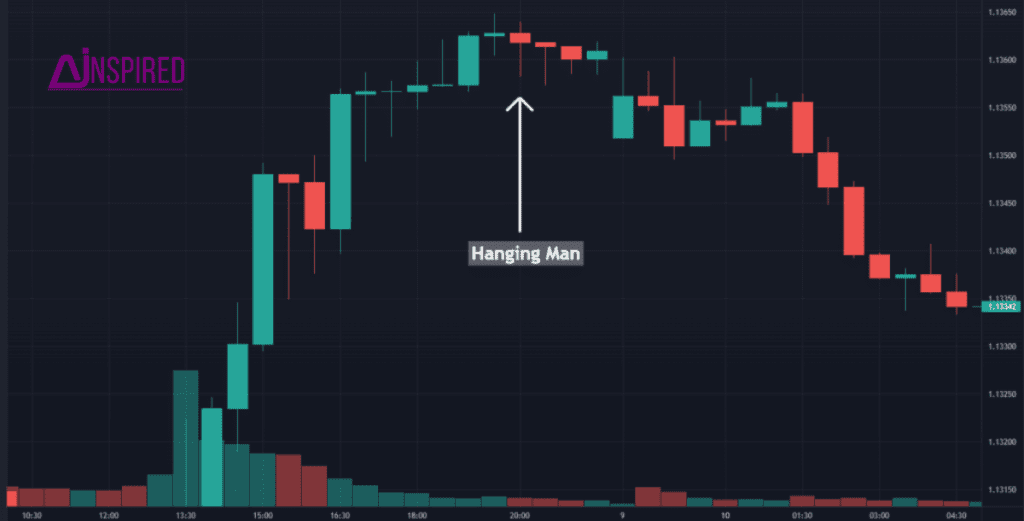
The Hanging Man Candle
In share market free course-2 we discuss about the hanging man candlestick.
The hangman candle, so named because it looks like a person who has been executed with legs swinging beneath, always occurs after an extended uptrend. The hangman occurs because traders, seeing a self off in the shares, rush in to grab the stock a bargain price.
In order for the hanging man signal to be valid the following conditions must exist:
- The stock must have been in a definite uptrend before this signal occurs. This can be visually seen on the chart.
- The lower shadow must be at least twice the size of the body.
- The day after the hanging man is formed, one should witness continued selling.
- There should be no upper shadow or a very small upper shadow. The colour of the body does not matter.
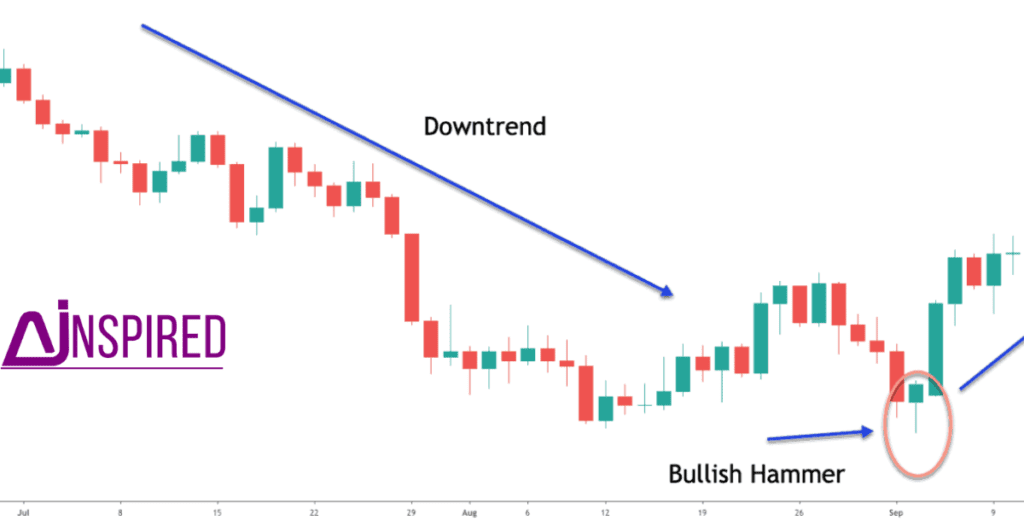
The Hammer
In share market free course-2 we discuss about the Hammer candlestick.
Hammer puts in its appearance after prolonged downtrend.On the day of the hammer candle, there is strong selling, often beginning at the opening bell. As the day goes on, however, the market recovers and closes near the unchanged mark, or in some cased even higher. In these cases the market potentially is “hammering” out a bottom.
In order for the hammer signal to be valid, the following conditions must exist:
The stock must have been in a definite downtrend before this signal occurs. This can be visually seen on the chart.
The lower shadow must be at least twice the size of the body.
The day after the hammer is formed one should witness continued buying.
There should be no upper shadow or a very small upper shadow. The colour of the body does not matter.
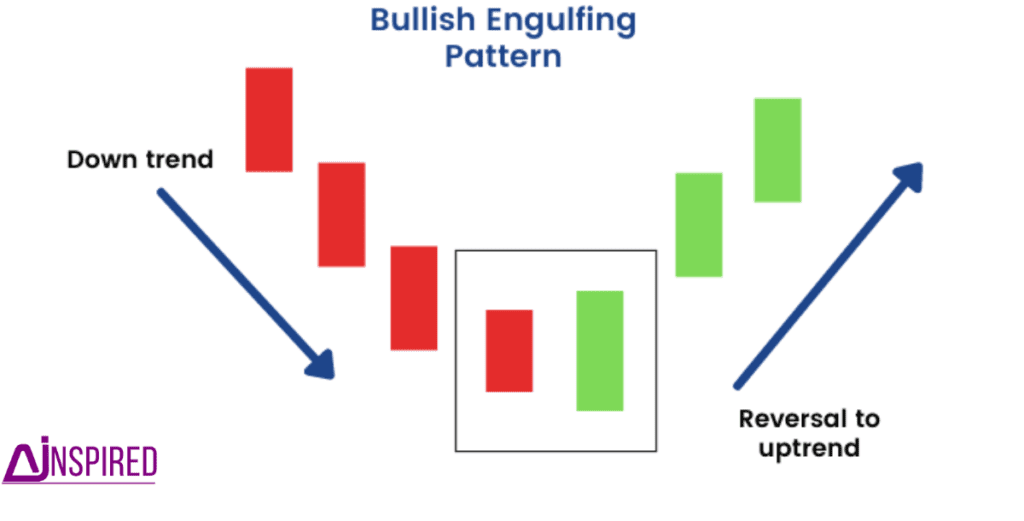
Bullish Engulfing
In share market free course-2 we discuss about the Bullish Engulfing candlestick.
A bullish engulfing candle occurs after a significant downtrend. Note that the engulfing candle must encompass the real body of the previous candle, but need not surround the shadow.
In order for the bullish engulfing signal to be valid, the following conditions must exists:
The stock must have been in a definite downtrend before this signal occurs. This can be visually seen on the chart.
The second day of the signal should be a white candle opening below the close of the previous day and closing above the open of the previous day’s black candle.
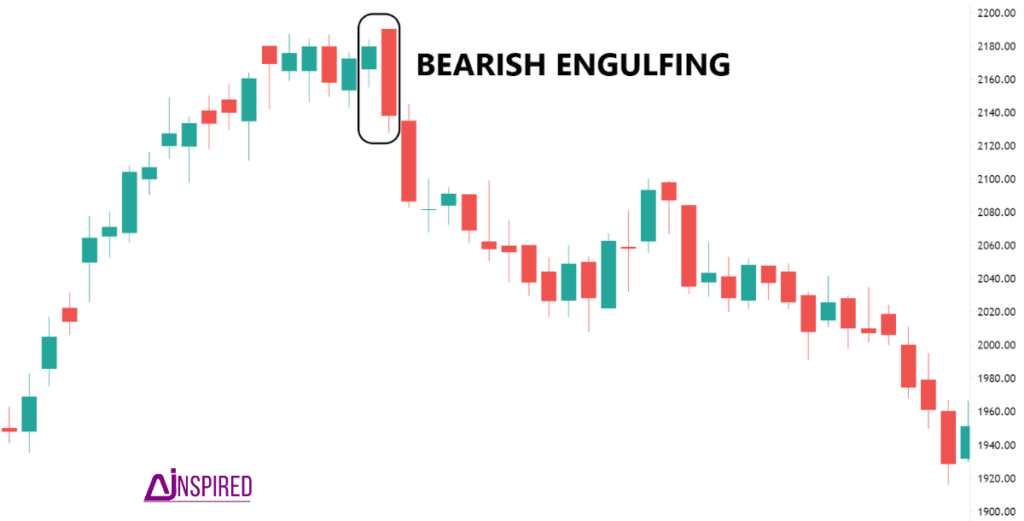
Bearish Engulfing
In share market free course-2 we discuss about the Bearish Engulfing candlestick.
A bearish engulfing candle occurs after a significant uptrend.Again, the shadows need not be surrounded.
In order for the bullish engulfing signal to be valid, the following conditions must exist:
- The stock must have been in a definite downtrend before this signal occurs. This can be visually seen on the chart.
- The second day of the signal should be a green candle opening below the close of the previous day and closing above the open of the previous day’s black candle.

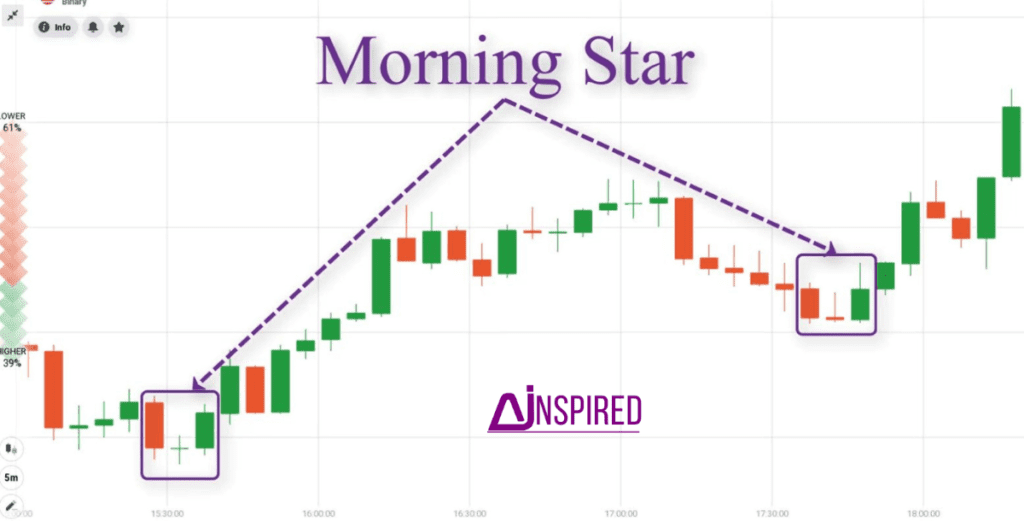
Morning star
In share market free course-2 we discuss about the morning star.
The morning star, that on the first day there is a large dark candle. The middle day is not a perfect star, because there is a small lower shadow, but the upper shadow on the top of a small real body gives it a star quality. The third candle is a large white candle that completes the reversal. Not how the third candle recovered nearly to the highs of the first day and occurred on strong volume.
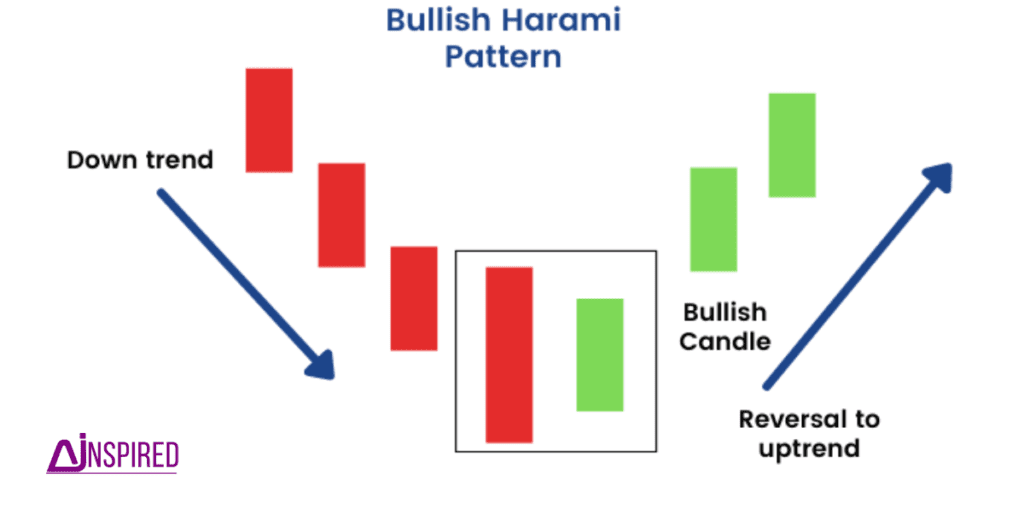
The Bullish Harami
In share market free course-2 we discuss about the bullish harami.
The bullish Harami candle can occur in either bullish or bearish trends, but the colors are revised. A large red body precedes a smaller green real body, and this gives out a bullish precedes a smaller green real body, and this gives out a bullish signal: It implies that the stock is poised to move upward.In Signal: In either bullish and bearish haramis, the upper and lower shadows can be of any size, and theoretically could even go above the real body of the clear candle day.
In order for the bullish harami signal to be valid, the following conditions must exist:
The stock must have been in a definite downtrend before this signal occurs. This can be visually seen on the chart.
The second day of the signal should be a green candle opening above the close of the previous day and closing below the open of the previous day’s red candle.
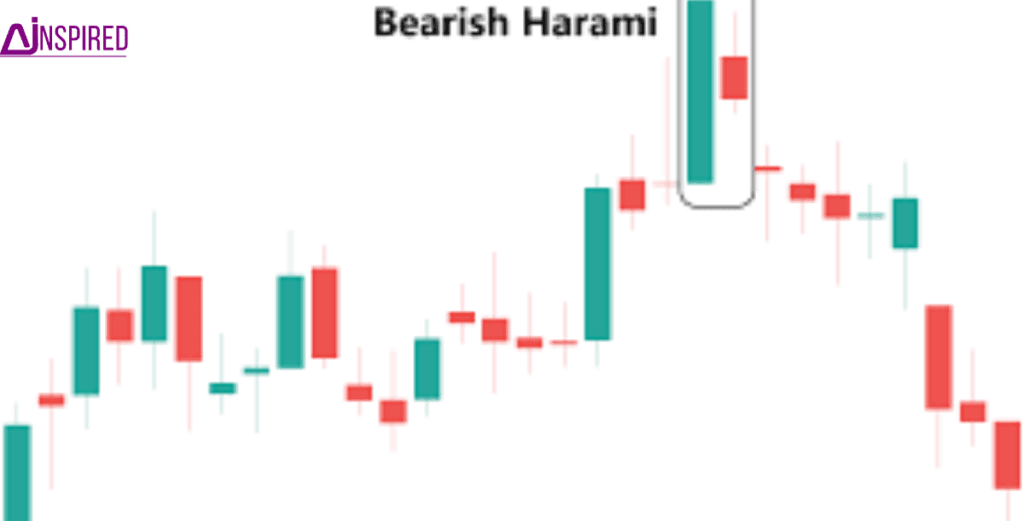
Bearish Harami
In share market free course-2 we discuss about the bearish harami.
In order for the Bearish Harami signal to be valid, the following conditions must exist:
The stock must have been in a definite uptrend before this signal occurs. This can be visually seen on the chart.
The second day of the signal should be a dark candle opening below the Close of the previous day and closing above the Open of the previous day’s white candle.
Marubozu
In share market free course-2 we discuss about marubozu.
Marubozu means “close-cropped” Typically, the marubozu is a long candle that implies the day’s trading range has been large. A marubozu candle lacks either an upper or lower shadow. On rare occasions it can lack both a upper or lower shadow. When a full marubozu occurs, or one that is very close to full, it is very well worth noting. If it is a white candle, then it signals extreme conviction among buyers. Conversely, if it is a dark candle, then it indicates sellers were eager to flee. AS always, you should pay careful attention to the nex day’s trading to see if there is follow through. A full or nearly full marubozu implies that there is strong buying or selling interest depending on the color. If there is follow through early the next day, the stock is likely to trend in that same direction for the next few sessions. That awareness can be important for the trader.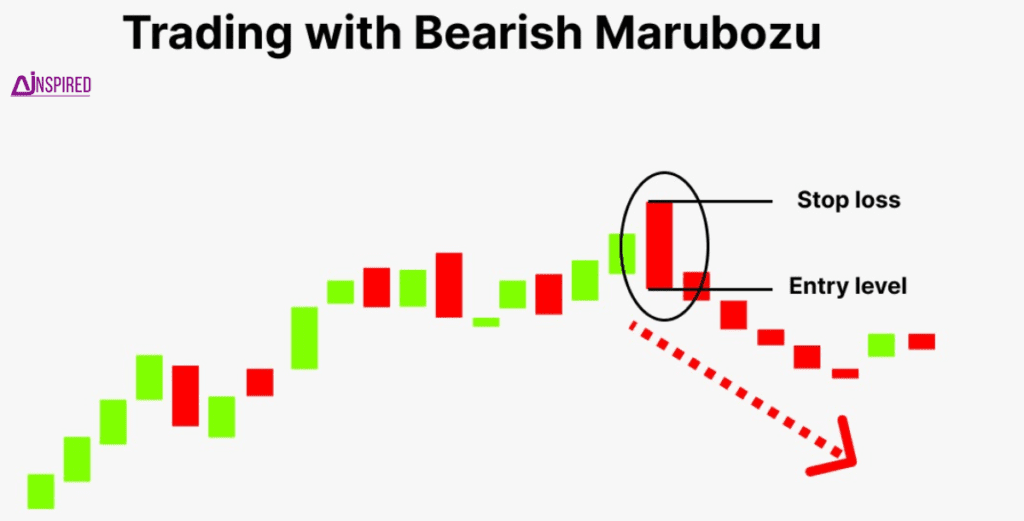
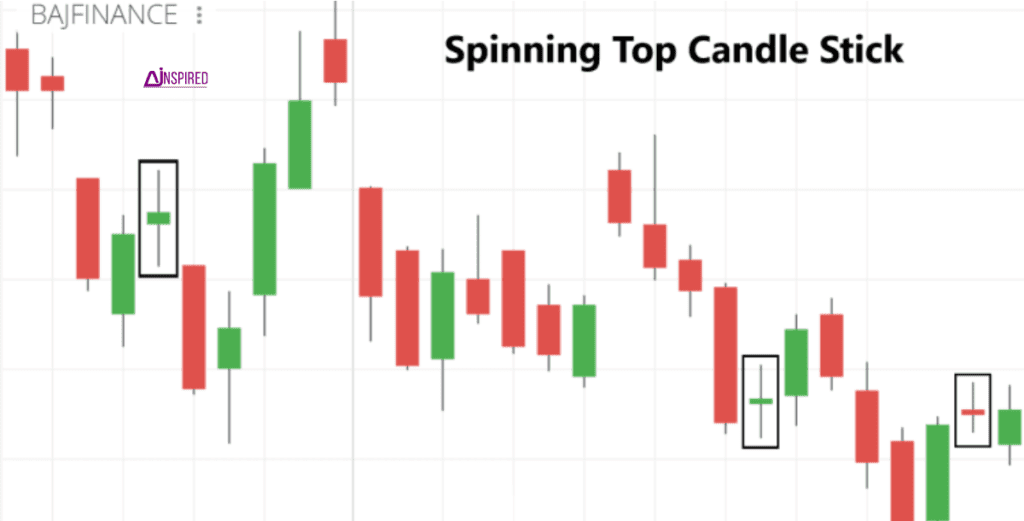
Spin top and spinning top high wave
In share market free course-2 we discuss about spin top and spinning top high wave.
Spin top , the shadow are relatively small and the candle has a very small range. When combined with low volume, traders may be expressing disinterest.
Spinning Top High Wave Definition:
A Spinning Top Wave, also called a High Wave candle, is candlestick that has an open and close price near each other which produces a small real body and color is of no importance. They also have long upper and lower shadows that significantly exceed the length of the body. These types of candlesticks indicate indecision and subsequent consolidation.
Practical Use:
Technical analysts will often watch for Spinning Top High Wave candlesticks and then “join the sidelines.” After such a volatile session, traders will often wait for additional confirmation of an upward or downward price movement.
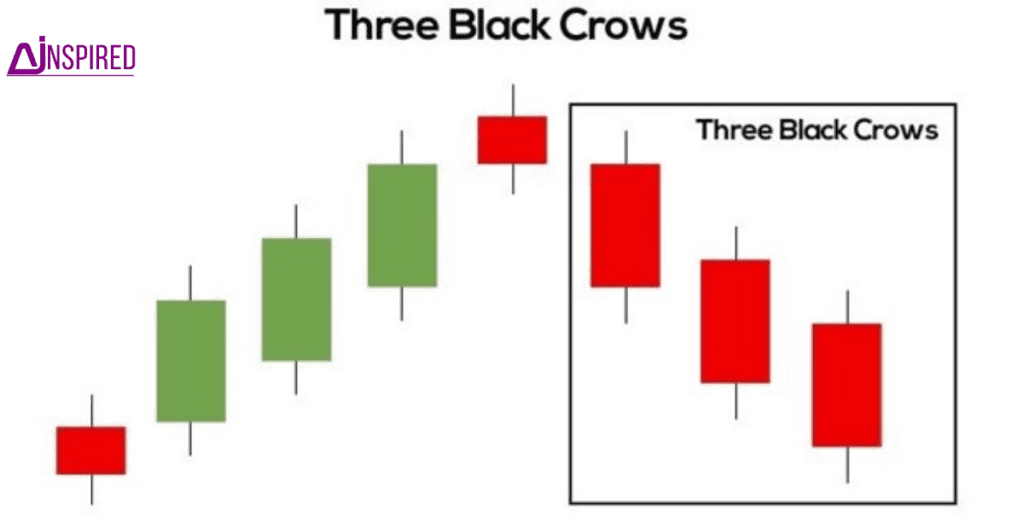
Three Black Crows
In share market free course-2 we discuss about three black crows.
The three black crows candle formation does not happen very frequently in stock trading, but when it does occur swing traders should be very alert to the crow’s caw. The candlestick’s metaphor is three crows sitting in a tall tree. On the day the first black crow makes its appearance, the formation is most predictive if the first “crow” or dark candlestick closes below the previous candle’s real body. Two more long-bodied consecutive down days then ensue. On each of these days, it appears as if the stock wants to regain its former strength, as the stock opens higher than the close on the previous day. By the end of each session, however, the sellers regain control and the stock drops to a new closing low.
Three White Soldiders
In share market free course-2 we discuss about three white soldiers.
The three white soldiers pattern is most potent when it occurs after an extended decline and a period of subsequent
consolidation. When a particular stock posts a decline followed by sideways movement, the appearance at that point of three white soldiers signals that higher prices are likely ahead. The first of the three white soldiers is a reversal candle. It either ends a downtrend or signifies that the stock Is moving out of a period of consolidation after a decline. The candle on day two may open within the real body of day one. The pattern is valid as long as the candle of day two opens in the upper half of day one’s range. By the end of day two, the stock should close near its high leaving a very small or non-existent upper shadow. The same pattern is then repeated on day three.

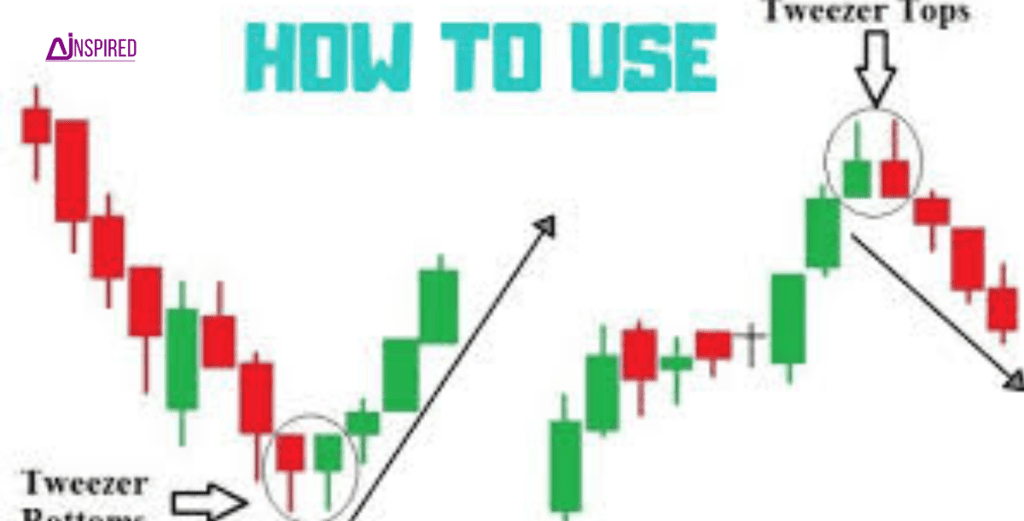
The Tweezers Formation
In share market free course-2 we discuss about the tweezers formation.
The tweezers formation always involves two candles. At a tweezers top, the high price of two nearby sessions is identical or very nearly so. In a high priced stock there may be a few cents variation, and I believer it should still be considered a tweezers. At a tweezers bottom, the low price of two sessions that come in close succession is the same. For simplicity, lets talk just about the tweezers bottom. In some instances, the tweezers bottom is formed by two real candlestick bodies that make an identical low. In other instances, the lower shadows of two nearby candles touch the same price level and the stock then bounces higher. A third possibility is that the lower shadow of one day and the real body of a nearby session hit the same bottom level.
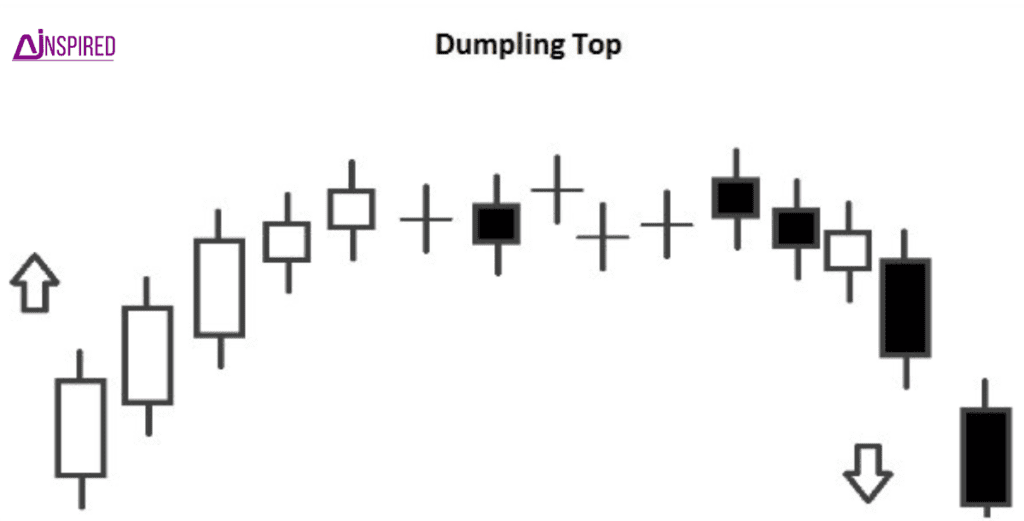
Dumpling Top Pattern
In share market free course-2 we discuss about dumpling top pattern.
Normally it should be a signal of Bearish reversal of the current trend.
It occurs during an Uptrend; confirmation is required by the candles that follow the Pattern.
The Pattern starts during an Uptrend, then it becomes a “Sideways” Trend (That represents the indecision of the Markets);
at the end of the Pattern, there is a reversal in the direction of the Trend and it becomes a Downtrend.
This Pattern is quite rare; is important that there is a Gap Down after the “Sideways” Trend and just before the start of the
Downtrend (To obtain a further confirmation of the reversal of the Trend, as the Pattern suggests).
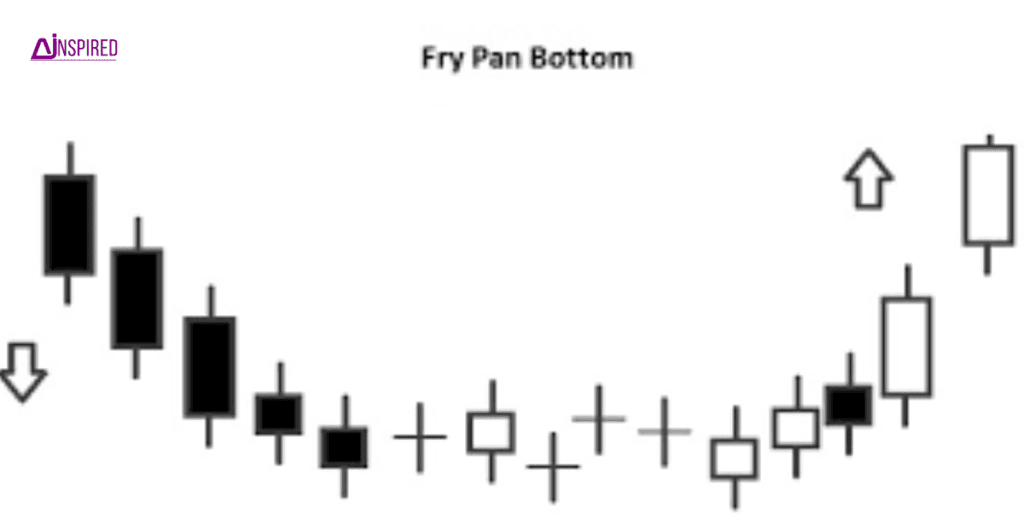
Fry Pan Bottom
In share market free course-2 we discuss about dumpling top pattern.
Normally it should be a signal of Bullish reversal of the current trend.
It occurs during a Downtrend; confirmation is required by the candles that follow the Pattern.
The Pattern starts during a Downtrend, then it becomes a “Sideways” Trend (That represents the indecision of the Markets); at the end of the Pattern, there is a reversal in the direction of the Trend and it becomes an Uptrend.
This Pattern is quite rare; is important that there is a Gap Up after the “Sideways” Trend and just before the start of the Uptrend (To obtain a further confirmation of the reversal of the Trend, as the Pattern suggests).
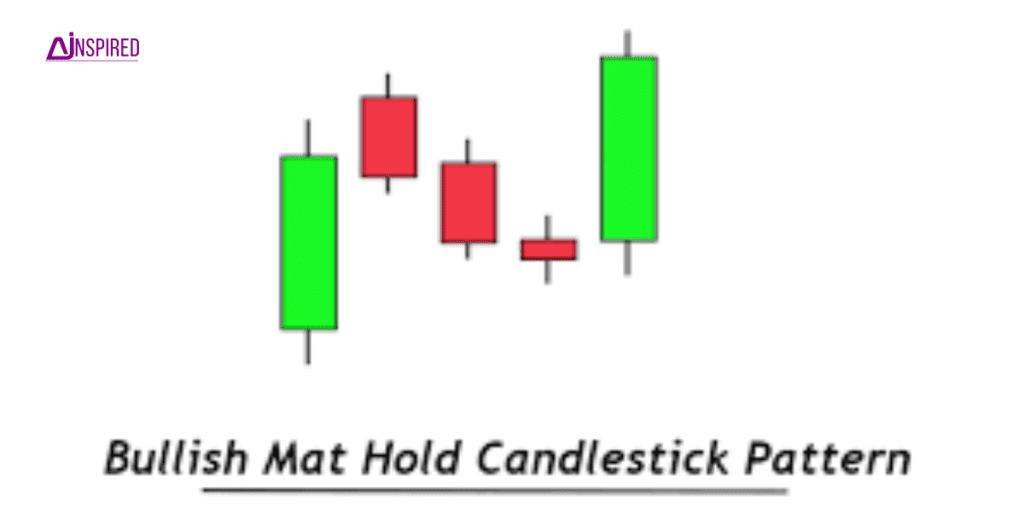
Bullish Mat Hold Pattern
In share market free course-2 we discuss about Bullish Mat Hold Pattern.
It occurs during an Uptrend; confirmation is required by the candles that follow the Pattern.
The First Candle is long and white.
The Second Candle is black, it has a short Real Body; moreover it has the Close above the Close of the First Candle.
The Third Candle can be white or black (It doesn’t matter), but it has a short Real Body.
The Fourth Candle is black, with a short Real Body.
The Second, Third and Fourth Candle represent a decline in prices; moreover their Real Bodies are above the Low of the First Candle.
The Fifth Candle is long and white; it has the Close above the High of the Second Candle.
Bearish Mat Hold Pattern
In share market free course-2 we discuss about Bearish Mat Hold Pattern.
It occurs during a Downtrend; confirmation is required by the candles that follow the pattern.
The First Candle is long and black
Then there is a Gap Down between the First and Second Candle.
The Second Candle is white, it has a short Real Body; moreover it has the Close below the Close of the First Candle.
The Third Candle can be white or black (It doesn’t matter), but it has a short Real Body.
The Fourth Candle is white, with a short Real Body.
The Second, Third and Fourth Candle represent a rise in prices; moreover their Real Bodies are below the High of the First Candle.
The Fifth Candle is long and black; it has the Close below the Low of the Second Candle.